Redesigning a pre-screening experience for Prolific
Background
Prolific is an online platform where researchers around the world can find and recruit a wide range of participants for an affordable price. On the other side, participants can contribute to science and research by answering surveys while earning a fair payment for their time.
The mechanics of the platform are quite straightforward and simple, but the complexities involved to ensure that researchers find the participants they need with the specific desired criteria and in the volume they need can be quite complex.
Problem
As a young start up, Prolific grew quickly in complexity, tech debt, and also UX debt. The section to filter participants - Audience section - was one of the services with most content and crucial information for users. It required a high level of cognitive load for researchers to find what they needed and assign filters to their studies. There were some crucial problems that needed a lot of attention:
The section contained about 250-260 filters in a logic that wasn’t always easy to understand.
Some of the filters were repeated in different categories and others contained spelling mistakes.
The entire section was displayed under a small modal that contained these categories under collapsable menus that closed every time an item was selected.
Once a filter was selected this modal would close which caused frustration to researchers selecting several filters in a session.
Also once a filter was added into their filters list to use Researchers couldn’t see the specific characteristics selected in each filter, so they had to enter in the modal again for reassurance and double-check if they had set it up properly.
There wasn’t an understanding of how often these screeners were being used, answered, or how they behaved over time.
In order to be eligible for a study in the platform, participants were requested to answer these questions. However, it didn’t mean that they would necessarily get more studies for doing so.

Constrains
One of the constraints of the team during this project was the low appetite to completely redesign this section as the understanding of its behavior wasn’t clear to us. There was a big need to get data about the filters’ usage, behavior, and demand from researchers in order to fully understand this service before redesigning the whole section.
However, it was clear that there were core UX problems we needed to solve in the short-medium term so researchers could have a better experience with the platform. We wanted to firstly reduce the cognitive load and provide relevant content at the right time in their journey.
Problem space
Alignment
As a first step, we ran workshops to better understand all the core attributes of researchers when selecting their participants. This way we ensured we understood all the possible problems to tackle, which ones we could tackle first, and which ones needed more information and data in order for the team to improve them.

We identified that time and sample accuracy were 2 attributes that we could improve and control at the stage we were at and with the resources we had.


We explored those attributes and mapped how researchers, participants, and internal systems could benefit from them. Then we prioritised these improvements taking into account their impact on users and certainty of it - how well we understood it.
Opportunity statement
This led us to create the opportunity statement that would help us focus on the problem at hand:
“How might we enable researchers to easily understand if their desired audience is available or not, which criteria we can provide 'for free' and which criteria they have to pay for to find out and how much?”
Understanding the baseline
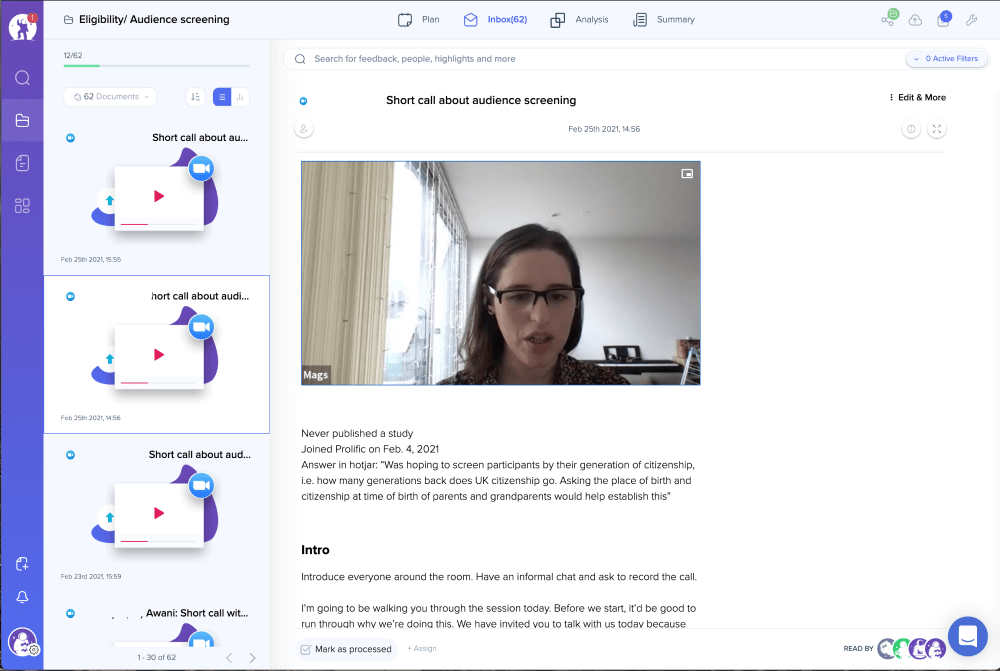
We decided we needed to set up a user satisfaction survey specifically about the audience so we could have a baseline to compare with the improvements (once these were implemented). We set up a survey in the product using hotjar and we quickly understood that users weren’t finding their audience even though we had the filters and people that they needed.

Hotjat survey
This validated some of the hypotheses we had already:
We have the participants and filters that researchers need but the interface wasn’t discoverable and searchable enough
The filters’ language might not be the most adequate for researchers to find participants.
Elaboration
In order to improve the service we knew we had to invest efforts on 3 different fronts:
Data:
Set metrics to track.
Implement these metrics.
Analyze the data to better understand the service and how people used it.
UX:
Validate and go deeper into the problems with Researchers in User interviews
Make options easily identifiable/ recognisable in the form.
Allow researchers to explore/add/remove several filters in one single session without having to reopen the modal for every single action.
Allow researchers to easily explore available filters, go back and forth between categories, and understand where screeners have been applied.
Content:
Make a filter audit.
Review all categories and filters.
Understand if we need new categories and/or reassign filters to different categories.
Revisit each filter’s questions and answers, correct spelling mistakes, and delete duplicates.
Design work
As a starting point, I documented the user flow for the audience section so I could better understand this process at the different stages and case scenarios of the researchers’ journey.
This also helped the team have a common understanding of the system and visualize gaps and opportunities to invest.

Iconography exploration
We organised and run several user interviews to validate our hypothesis and suspicions about the problem at hand. This allowed us to go into some further details in the copy and filters’ nature.

Content
As soon as we had available data on the filters’ usage it became clear which categories were most used and crucial to researchers. As a core element of this service, I felt that regardless of the improvements to the interface we first had to understand the content, the taxonomies used, and how we could improve it.
We collected all the filters available in the platform and suggested improvements for the team to review and implement:
Identify duplicates and removed them
Correct spelling mistakes
Merge some categories
Eg.: We had three categories covering "Health":
Health
Physical Health
Mental Health
Create new categories such as ‘Technology and online behavior’ which had already a lot of filters under the “Other” category but could be more discoverable under a relevant topic
Reassigned filters to more relevant categories. Example:
Old category: “Hobbies”
Filter title: “Genetically engineered food products”
Question asked: “To what extent do you believe the following statement to be true: “Genetically engineered (GE) food products are worse for health than non-GE food products
Moved to: “Beliefs and ideals”
Created subcategories under categories so researchers can identify the topic being covered in long lists of filters

Filter audit

Correction and identification of filters that needed reassigning

Revisiting screeners and their categories and subgroups
Product design elaboration:
Now that I had a better understanding of the filters' usage and how the service worked I could deep dive into user interface improvements. I proposed a list of improvements with time and cognitive load efficiency in mind:
Call to action (the entry point to the Audience section) shorter and clearer in language
Layout:
Full-width search input was placed at the top of categories so it was discoverable and available at all times.
Two scrollable panels in the modal:
The left-hand side panel contained the categories list
The right-hand side panel contained the filters list of the selected category
This would encourage users to browse and discover the filters inside each category much faster, and give them the option to search if they didn’t find it.
Extra indicators for validation
Indication of the number of participants available inside the modal updating as researchers add a filter
The ability to select several screeners at once without closing the modal
A counter under each category of how many screeners have been added to the study
An indication in the filters was added so that researchers could quickly identify them in the list view
Outside of the modal:
A summary of all selected filters for reassurance before launching their study

Screeners summary and new modal layout and restructure

Design specs in figma
Usability tests
To test this work I used Maze app to run initial async usability tests of 2 prototype versions I created in Figma. I recruited 40 researchers through Prolific (researchers with participant accounts) and set a usability test for them to go through and give their feedback on the improvements.

The findings:
The results were quite promising and positive, and there were some good suggestions for improvements. I decided to iterate and incorporate the suggestions given and run moderated usability tests with 5 researchers for reassurance in the new designs.
We all felt confident with the proposed changes and we moved into the development phase in the app.
Outcome
8 weeks after releasing this work we compared both the baseline and the new user satisfaction surveys and found out that:
The efficiency of screener selection increased by 6% with the new designs 🚀
The user satisfaction rate grew from 4.26 o 4.33 ❤️
Researchers were applying screeners more easily in the new modal and had fewer filter removals in a section
Old modal
User AVR satisfaction rate (1-5) = 4.26
Researchers that found screeners = 81.5%
New modal
User AVR satisfaction rate (1-5)= 4.332051282
Researchers that found screeners = 87%
We are now planning to revisit this section to implement a custom filter creation and optimization with ‘allow’ and ‘block’ lists so we can bring even more value to researchers when using this feature.
Date: June, 2021
Product: Prolific